You other nerds can't
deny
That when a girl walks
in with a big spreadsheet
And a pie chart in
your face
You're stunned, wanna
put your glasses on
I like data because there is something tangible and reassuring about watching results. I've
accumulated quite a bit of data during my treatment. As I go through the
treatment process, I'm tracking and counting and marking things on the
calendar. Chemo #11 was last week and dutifully marked on the calendar. I only have one more treatment to go if you're following along at home. Every session, I get blood taken to make sure I'm healthy enough to take a drug
cocktail that makes me sick and better at the same time. They hand me my
printout with my numbers to scrutinize.
The numbers I'm watching are my
platelets because if they drop too low I cannot take my next chemo
thus disrupting my carefully laid out schedule. I'm also watching my CEA
(carcinoembyonic antigen) or tumor marker. According to my doctor, this is an
indication that the chemo is working to attack the tumors and that they are not
growing. The real measurement of progress are CT or PET scans to measure the
size. However, the blood test is far cheaper and quicker than the scans that
only happen every 3-6 months.
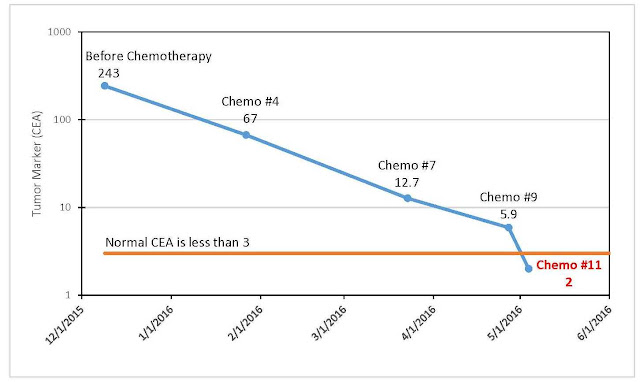
Because I like numbers and seeing results, I made a graph of my CEA progress. Doesn't everyone like a pretty graph?

The last CEA test result was 2.0 which is in the range of a healthy person (less than 3.0). I'm normal! Well, as far as my CEA goes. The rest is debatable.
Because I like numbers and seeing results, I made a graph of my CEA progress. Doesn't everyone like a pretty graph?

The last CEA test result was 2.0 which is in the range of a healthy person (less than 3.0). I'm normal! Well, as far as my CEA goes. The rest is debatable.
No comments:
Post a Comment